Project planning that lives where you work
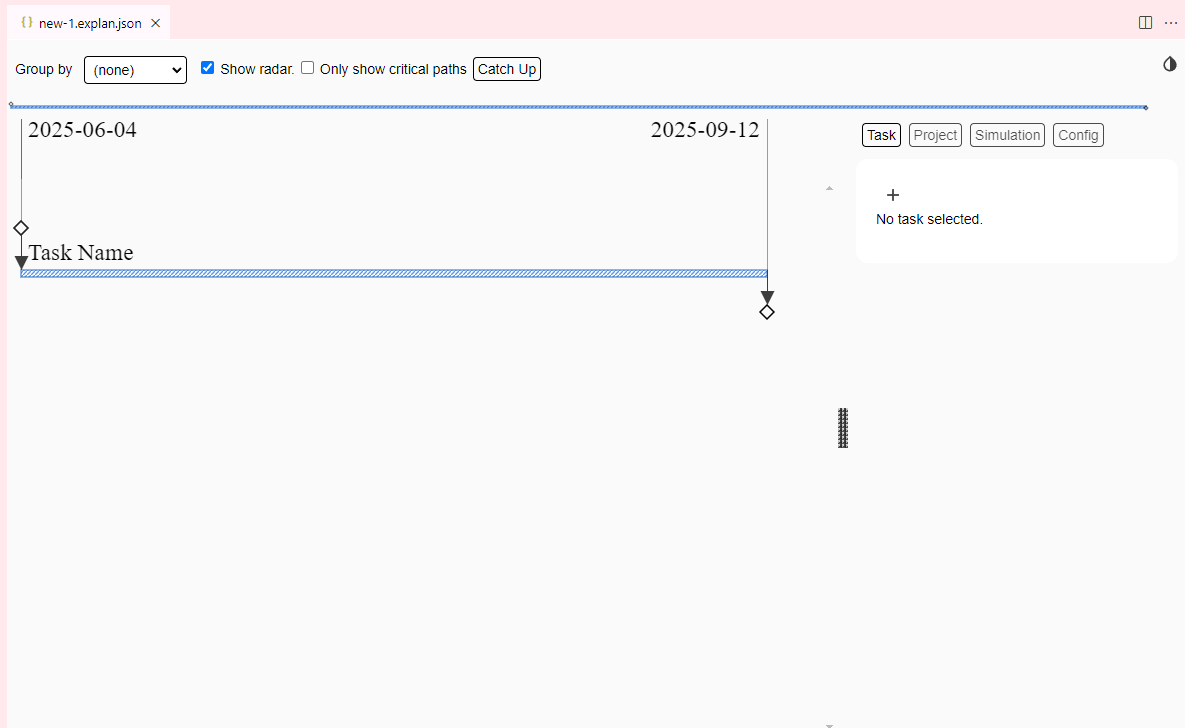
Explan is a visual Gantt-style project planner built directly into VS Code. Create, edit, and explore project timelines without leaving your editor — no browser tabs, no dashboards, no loading screens.
Built for developers who plan
Everything you need to manage technical projects, without leaving your coding environment.
Native VS Code Extension
Designed for technical project managers who already live in VS Code. Plan your work right alongside your code, in the same window.
Version Control Friendly
Plans are stored as plain .explan files that live alongside your code.
Diff, merge, and track changes with git like any other file.
Instant & Offline
No login, no loading screens, no subscriptions. Explan works entirely offline. Open a file and start planning immediately.
Uncertainty Simulation
Accounts for task uncertainty with Monte Carlo simulation. Get realistic probability distributions for completion dates, not just best-case estimates.
Fully Customizable
Add custom resources (like assignees) and metrics (like cost) to fit projects of any shape and size. Group and filter tasks any way you need.
Keyboard Driven
Navigate, create, and edit tasks entirely from the keyboard. Full shortcut support so you never have to reach for the mouse.
Dark mode and light mode
Adapts to your VS Code theme. Toggle between dark and light mode with
Shift-Ctrl-M.
Get started in seconds
No configuration required. Just install and start planning.
Install the extension
Find Explan on the
VS Code Marketplace,
or search for Explan in the Extensions panel
(Ctrl+Shift+X).
Create a plan file
Run Explan: Create new Explan Document from the command
palette (Ctrl+Shift+P), or create any file with the
.explan extension.
Start planning
Add tasks, set durations, link dependencies, and run simulations —
all inside VS Code. Press Shift-Ctrl-H to see all
keyboard shortcuts.
Ready to plan your next project?
Install Explan for free, or try it right now in your browser.